DW Gym — 3 day Python challenge

Today I reveived certyficate of finish 3 day python challenge organized by Data Workshop. The challenge was in december of previous year but I think this is a good idea to repeat what we trained. The main topic on challenge was Pandas library. I think it's the most popular library in Python to work with data.
certyficate
In this post I will show all commands used in challenge exercises. Also, I will write how to start with Pandas and how to run your code with some data and try to execute these commands.
Firstly, we need some data and environment. A lot of datasets we can find on kaggle.com. I choosed set with video games. To eaisly work with data we can choose Jupyter. The fastest way is using it with docker.
How to run it? Just execute a command:
docker run --rm -p 8888:8888 -e JUPYTER_ENABLE_LAB=yes -v ${PWD}:/home/jovyan/work jupyter/datascience-notebook
Remember: ${PWD} evaluated to current directory. I execute command in directory when I save dataset file.
Working with Pandas
With short explanations.
Import library to using it. pd is only alias, but using very often and treat as good practice.
import pandas as pd
 dw_gym_1
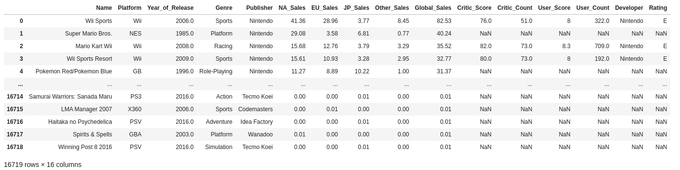
Load csv dataset. Of course datasets can be in other formats like xlsx. Typing only pd and executed shows result like print() function
df = pd.read_csv('./work/Video_Games_Sales_as_at_22_Dec_2016.csv')
df
 dw_gym_2
To show some rows without printing everything
df.head()
 dw_gym_3
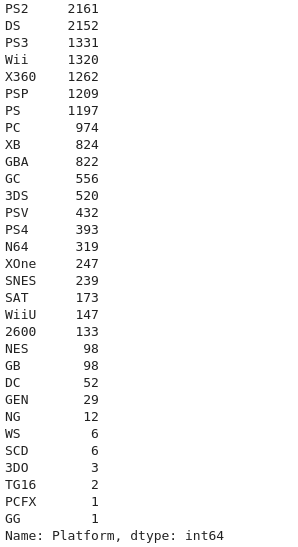
The numbers of (rows, columns)
df.shape
    (16719, 17)
 dw_gym_4
For each column we can display unique values. In this example for Platform column
df.Platform.unique()
 dw_gym_5
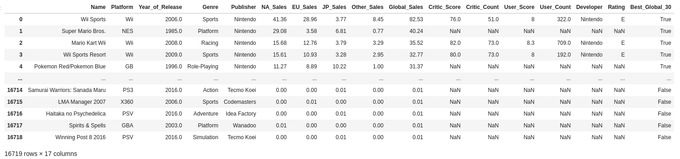
Fuction to count how many rows have a unique value for column. In this example for Platform
df.Platform.value_counts()
 dw_gym_6
Function apply on data frame alows to work with each row. In this example we not doing anything. Just returned row
df.apply(lambda row: row, axis=1)
 dw_gym_7
The same like above but we returning keys and it's mean - column names
df.apply(lambda row: row.keys(), axis=1)
 dw_gym_8
Choosing only one column from row
df.apply(lambda row: row['Platform'], axis=1)
 dw_gym_9
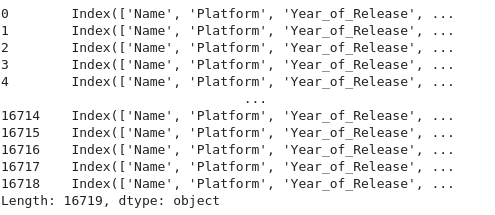
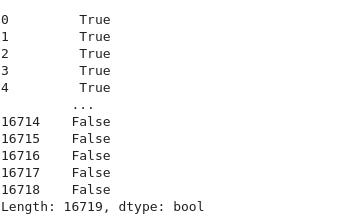
Add statement to check data. It's evaluate to True and thats why we see only booleans on output
df.apply(lambda row: row['Global_Sales'] > 30, axis=1)
 dw_gym_10
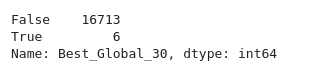
Mix using apply() and value_counts()
df['Best_Global_30'] = df.apply(lambda row: row['Global_Sales'] > 30, axis=1)
df['Best_Global_30'].value_counts()
 dw_gym_11
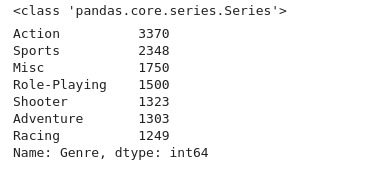
Get value_counts() of column and choose only by statement. Pandas work on this data as a Series of data. Details in documentation.
genre_values = df['Genre'].value_counts()

top_ten_genre_values = genre_values[genre_values > 1000]
top_ten_genre_values
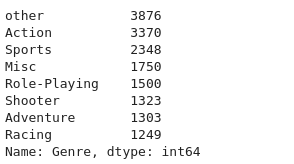
Using filtered only top values we can work again with main data
genre_norm = df["Genre"].map(lambda x: x if x in top_ten_genre_values else "other")
genre_norm.value_counts()
 dw_gym_12
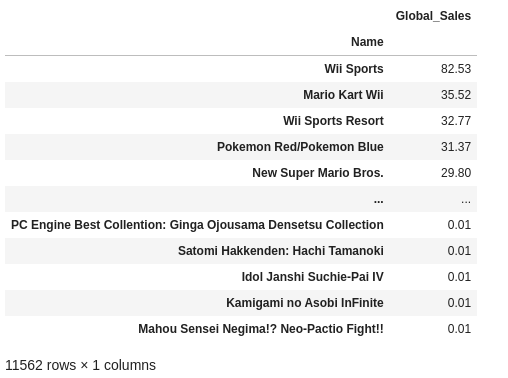
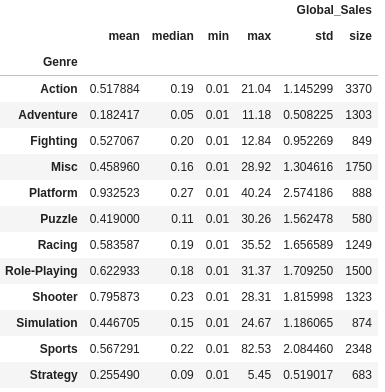
Grouping and aggregate functions. Pandas contains data structures like pivot_table, and allows us to count values like minumum, maximum etc
pd.pivot_table(df, values=["Global_Sales"], index=["Name"]).sort_values(by=("Global_Sales"), ascending=False)

(df[["Global_Sales", "Genre"]]
    .groupby("Genre")
    .agg(["mean", "median", "min", "max", "std", "size"])
)
 dw_gym_13
Thanks for reading this. It was a small recap of workshop exercises.
Marcin